%20--%3e%3cdefs%3e%3cstyle%3e%20.st0%20{%20fill:%20%23a5d028;%20}%20.st1%20{%20fill:%20%23fff;%20}%20.st2%20{%20fill:%20%231de2db;%20}%20.st3%20{%20fill:%20%2341bdf9;%20}%20%3c/style%3e%3c/defs%3e%3cg%20id='logo-unaice-line'%3e%3cpath%20class='st1'%20d='M143.3,36.1c-1.2,0-2.1-.9-2.1-2.1V12.2c0-1.2.9-2.1,2.1-2.1s2.1.9,2.1,2.1v21.8c0,1.2-.9,2.1-2.1,2.1ZM143.2,6.2c-1.3,0-2.4-1-2.4-2.4v-.8c0-1.3,1-2.4,2.4-2.4s2.4,1.1,2.4,2.4v.8c0,1.3-1.1,2.4-2.4,2.4Z'/%3e%3cpath%20class='st3'%20d='M23.7,36.1H2c-.5,0-1-.4-1-1V2.3c0-.5.4-1,1-1h21.7c.5,0,1,.4,1,1v32.9c0,.5-.4,1-1,1'/%3e%3cpath%20class='st2'%20d='M41.8,36.1h-14.4c-.5,0-1-.4-1-1v-14.5c0-.5.4-1,1-1h14.4c.5,0,1,.4,1,1v14.5c0,.5-.4,1-1,1'/%3e%3cpath%20class='st0'%20d='M41.8,17.9h-14.4c-.5,0-1-.4-1-1V2.2c0-.5.4-1,1-1h14.4c.5,0,1,.4,1,1v14.7c0,.5-.4,1-1,1'/%3e%3c/g%3e%3cpath%20class='st1'%20d='M196.4,29.2c-2.1,2.1-3.6,3.2-7.1,3.2s-7.4-2.3-8.2-7.4h16.7c2.7,0,2.9-1.9,2.7-4-.7-6.2-5.3-11.2-11.6-11.2s-12.3,5.1-12.3,13.4,5.4,13.3,12.6,13.3,8.3-2.6,10-4.3c1.8-2.1-1.2-4.7-2.8-3ZM188.9,13.7c4.7,0,7.3,4.1,7.6,7.3h-15.3c.7-4.3,3.4-7.3,7.7-7.3Z'/%3e%3cpath%20class='st1'%20d='M132.1,12.9c-1.9-1.9-5.4-2.9-8.2-2.9s-5.3.5-8.2,1.8c-2.4,1-.9,5,1.6,3.7,2.1-1,3.3-1.5,6.3-1.5s6.7,1.1,6.8,6.1c-1.8-.5-2.7-.8-6.9-.8-6.8,0-11.3,3.3-11.3,8.8s4.1,8.4,10.1,8.4,5.4-.6,8.3-2.9v.5c0,2.8,4.2,2.6,4.2,0v-13.8c0-3.1-.8-5.5-2.7-7.4ZM130.4,26.2c0,3.6-3.4,6.3-8,6.3s-5.9-1.7-5.9-4.6,2.5-4.6,6.8-4.6c0,0,4.8,0,7.1,1v1.9Z'/%3e%3cpath%20class='st1'%20d='M80,36.1c-1.2,0-2.1-.9-2.1-2.1V3.4c0-1.2,1-2.2,2.2-2.2h.4c.8,0,1.4.4,2,1.1l20.2,25.7V3.4c0-1.2.9-2.1,2.1-2.1s2.1.9,2.1,2.1v30.7c0,1.1-.5,2-1.9,2s-1.9-.8-2.2-1.2l-20.7-26.2v25.3c0,1.2-.9,2.1-2.1,2.1Z'/%3e%3cpath%20class='st1'%20d='M60.2,36.5c-5.1,0-10.5-4.3-10.5-10.7v-13.5c0-1.2.9-2.1,2.1-2.1s2.1.9,2.1,2.1v13.1c0,4.5,2.5,7.1,6.6,7.1s7.3-3.2,7.3-7.5v-12.7c0-1.2.9-2.1,2.1-2.1s2.1.9,2.1,2.1v21.8c0,2.8-4.2,2.7-4.2,0v-.5c-1.5,1.6-3.3,2.9-7.6,2.9Z'/%3e%3cpath%20class='st1'%20d='M163.8,36.5c-7.1,0-13.1-6-13.1-13.3s4.8-13.5,13.5-13.5c4.4,0,6.9,2,8.8,3.7,1.8,1.5-.8,5.1-2.8,3.3-.8-.8-3.3-3-6.4-3-4.8,0-8.6,4-8.6,9.2s3.8,9.3,8.6,9.4c3.7,0,4.9-1,7-3.1,1.6-1.8,4.6,1,3,2.8-3,3-5.7,4.5-10,4.5h0Z'/%3e%3c/svg%3e)
Your equipment is running at full capacity—but the data is misleading
Three months of work, a modern MES system implemented—and yet, at the end of the month, the reported efficiency figures differ drastically from reality. Why? If Overall Equipment Effectiveness (OEE) doesn’t provide the expected transparency, the problem is almost never due to the machines’ hardware. The cause is usually deeply hidden in the quality of the underlying production data.
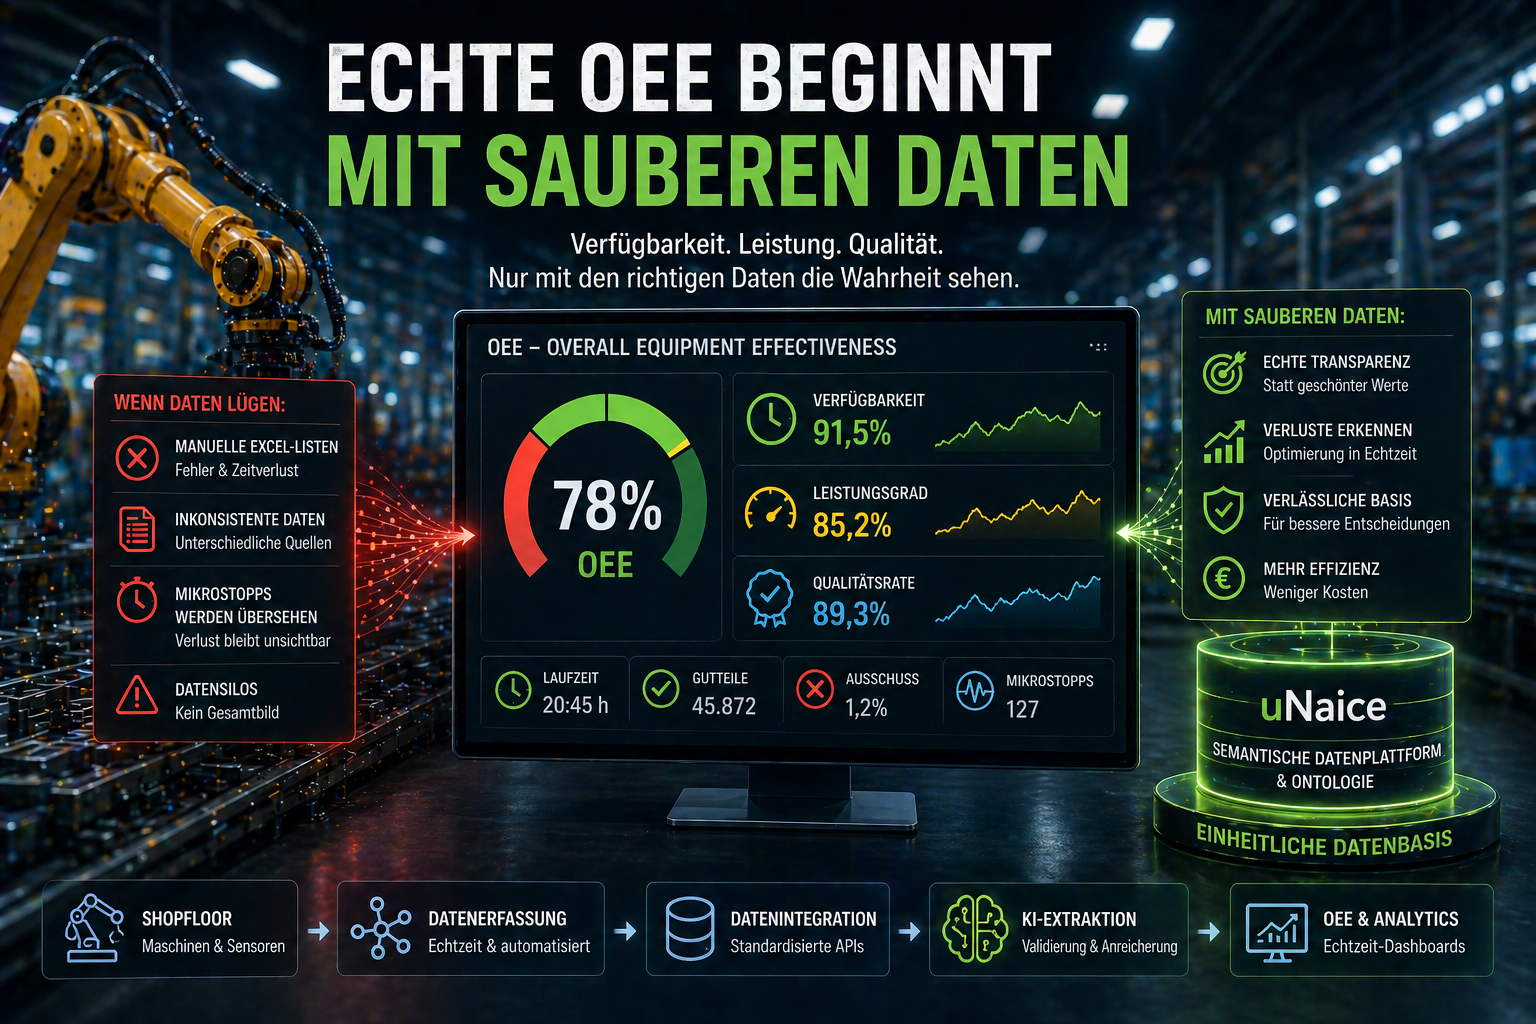
Overall Equipment Effectiveness combines three key components into a single value:
But inaccurate supplier data, inconsistent measurement criteria, and tedious manual Excel tasks distort this picture dramatically. A study by Teeptrak (2025) sums it up: The OEE reported in many factories is simply not the true OEE. There is a lack of a clean ontology that logically links the data assets.
In this expert guide, we address a crucial practical question: What data structures are absolutely necessary to calculate Overall Equipment Effectiveness ? We’ll show you how to break down isolated data silos, eliminate the “human bottleneck,” and build a 100% error-free quality pipeline for your master data with uNaice.
Why do many industrial companies fail to seamlessly link MES and supply chain data?
Unlike isolated standalone systems, a seamless link between MES and supply chain data provides an error-free foundation for precise OEE calculation.
According to the industry portal Teeptrak (2025), many factories confidently report an OEE of 78%, but these figures are based on error-prone Excel spreadsheets and manual logs. The main problem lies in the lack of semantic structure in the data. Unstructured raw data from the shop floor cannot be easily integrated with the rigid table structures of an ERP system. Micro-stops of less than 30 seconds are often completely ignored because they cannot be recorded manually, which massively distorts overall equipment effectiveness.
At uNaice, we see firsthand every day how this untapped data capital costs companies a lot of money and valuable capacity. The solution requires a decisive shift away from manual entries toward automated, AI-powered systems. Only when machine data and external logistics data speak the same “language” can you create a reliable foundation for your production planning. Would you like to know how this integration can work in your company? Feel free to contact us for a no-obligation analysis.
uNaice automates bidirectional data exchange between the shop floor and ERP systems via standardized API interfaces
uNaice’s semantic data extraction transforms unstructured raw data into structured master data and breaks down isolated data silos.
A recent analysis by Industrie-Wissen.de (2025) shows that accurate data collection and the integration of automated systems are absolutely essential to ensure the integrity of every component. To break down historical data silos, companies must establish a central data management platform for the industry. These platforms organize information as intelligent knowledge graphs (ontologies), so that machine logs, production records, and quality inspection reports are logically linked.
This modern approach reduces manual data maintenance by up to 75%. Our technology addresses this need by transferring millions of items into a clean quality pipeline. Companies like adidas and Otto use such structures to efficiently leverage data capital. The solution scales seamlessly from 10,000 to 5 million data records without requiring you to hire new staff for data maintenance.
What data structures are essential for calculating Overall Equipment Effectiveness?
Overall Equipment Effectiveness (OEE) is a metric derived from the product of equipment availability, performance, and production quality.
The trade journal Fastec (2025) makes it clear that this precise calculation must account for 100% of losses resulting from unplanned downtime, deviations from the planned production volume, and defective parts. To accurately determine these 3 main factors, you need specific, standardized data structures that communicate in real time. A detailed understanding of these components enables precise diagnosis and continuous operational optimization across the entire manufacturing process.
Since this topic is highly complex for supply chain managers and leaves no room for interpretation, we will examine the individual mandatory data structures in detail in the following 3 sections. Only when all levels mesh seamlessly can you release the handbrake on your production.
Data Structures for the OEE Availability Factor
The OEE availability factor is the mathematical ratio between the actual and the theoretically possible production time of an industrial plant.
According to Fastec (2025), availability is primarily reduced by malfunctions and the time required to resolve them. The underlying data structure must record the planned production time against the actual operating time with a precision of less than 1 second. Industrie-Wissen.de (2025) emphasizes that downtime and its exact causes must be systematically extracted from machine logs.
In this context, 100% consistent timestamp synchronization across all data sources is essential to ensure temporal correlations. Line setup and teardown also measurably reduce this factor. If you build these data structures with clean semantics, you will obtain reliable values that are not distorted by manual estimates from machine operators.
Data Structures for the OEE Performance Factor
The OEE performance factor is a metric that shows how efficiently a machine operates compared to its maximum capacity.
The calculation of OEE performance is often based on a theoretical reference cycle, which, as Teeptrak (2026) warns in a recent study, was in some cases established 15 years ago during commissioning and no longer reflects reality. The data structure for performance metrics compares measured production rates with continuously updated target cycle times.
According to Procom Automation (2025), speed losses must be precisely recorded in order to make the often-cited “hidden losses” visible at all. The data models must be able to map tool changes, material changes, or equipment wear in real time. Only by using automated data collection systems can you verify this performance data with over 99% accuracy and use it for predictive maintenance.
Data Structures for the Quality Rate
The quality rate is the percentage of defect-free units produced relative to the total production volume of a shift.
Industrie-Wissen.de (2025) explains that quality data requires complete tracking of the number of conforming units, whereby defects and rework rates must be precisely identified. The data structure must logically link information from quality inspection reports and optical sensor data. According to Procom Automation (2025), OEE cannot be reliably calculated if defective parts are not accurately recorded.
In our practice, we recommend the use of AI-supported Validation Station technology. Through the intelligent interplay of 99% AI automation and human final inspection, this guarantees a 100% error-free database for your quality metrics. This ensures that scrap rates are accurately reflected in overall equipment effectiveness and that no embellished figures are reported to management.
Which integration concepts are best suited for real-time integration of external supplier data?
A modern integration architecture consists of event-driven APIs, automated data transformation layers, and a central semantic knowledge graph.
The integration of external supplier data in real time often fails in the industry due to unstructured formats such as PDFs or inconsistently maintained Excel lists provided by suppliers. Rigorous validation and cleansing of the collected data is necessary in three phases to prevent distortions in the subsequent OEE calculation, as Industrie-Wissen.de (2025) impressively confirms. Unlike error-prone manual entry, an AI-based interface concept offers automatic normalization of units and correction of typos in milliseconds.
At uNaice, we solve this problem with our ontology-based AI, which understands data logically rather than merely shuffling text blocks, as is the case with “black-box AIs.” This enables companies like TUI to integrate unstructured data error-free while saving up to 75% of manual labor time. Let’s evaluate together how this concept can secure your supply chain.
What are the most important architectural requirements for a seamless digital twin of the supply chain?
A seamless digital twin of the supply chain consists of three central architectural components: real-time IoT data collection, a semantic integration layer, and a cloud-based data lake.
This structure enables a virtual 1:1 mapping of physical production and logistics processes. Recent analyses show that industrial companies can reduce their response time to supply bottlenecks by up to 45% by implementing a digital twin. To successfully build this complex architecture, you must meet the following technical requirements:
In this context, the key question inevitably arises: What data structures are absolutely essential for calculating Overall Equipment Effectiveness? Only when the digital twin operates on a 100% clean data foundation can you proactively avoid bottlenecks. uNaice’s technology supports you in this architectural transformation by transforming unstructured raw data into machine-readable master data.
How do you establish reliable data governance for extremely heterogeneous machine data in manufacturing?
Strict data governance enables the systematic minimization of data integrity issues and ensures precise OEE assessments across all systems.
Industrie-Wissen.de (2025) emphasizes that inaccurate or incomplete data often results from sensor errors, manual input errors, or inconsistent measurement criteria. To prevent this, you must implement rigorous validation protocols and ensure standardized data entry procedures for all employees. Data governance must clearly define who bears strategic responsibility for the quality of the collected process data in an industrial setting.
We strongly advise our customers to rely on automated data collection technologies with real-time error detection. Regular calibration of measuring instruments and thorough training for responsible personnel have been proven to increase data processing accuracy by over 80%. With uNaice, you also benefit from our transparent flat-rate model: We charge exactly €0 per SKU, giving you full budget control when scaling your data governance.
Conclusion: Master Data Perfection for Your Production Facilities
Unlike outdated manual methods, AI-powered master data perfection offers the only reliable basis for accurate OEE calculation.
The question: What data structures are absolutely necessary to calculate Overall Equipment Effectiveness ? can now be clearly answered: You need standardized, millisecond-precise, and semantically validated data for availability, performance, and quality. Inaccurate measurements from Excel spreadsheets cost you money and obscure valuable production capacity. As a “Made in Germany” software solution, uNaice offers you GDPR-compliant and fully automated processing of your product data in over 40 languages.
By combining semantic data extraction with our Validation Station, we guarantee an error-free quality pipeline that grows with your business. Schedule a free initial consultation now or book our no-obligation 100-record trial. We’ll demonstrate directly using your own data how you can overcome the “human bottleneck” and make the most efficient use of your data assets.
Frequently Asked Questions
Ready for the next step?
Contact us for a no-obligation consultation about your data project.
Contact us nowSources